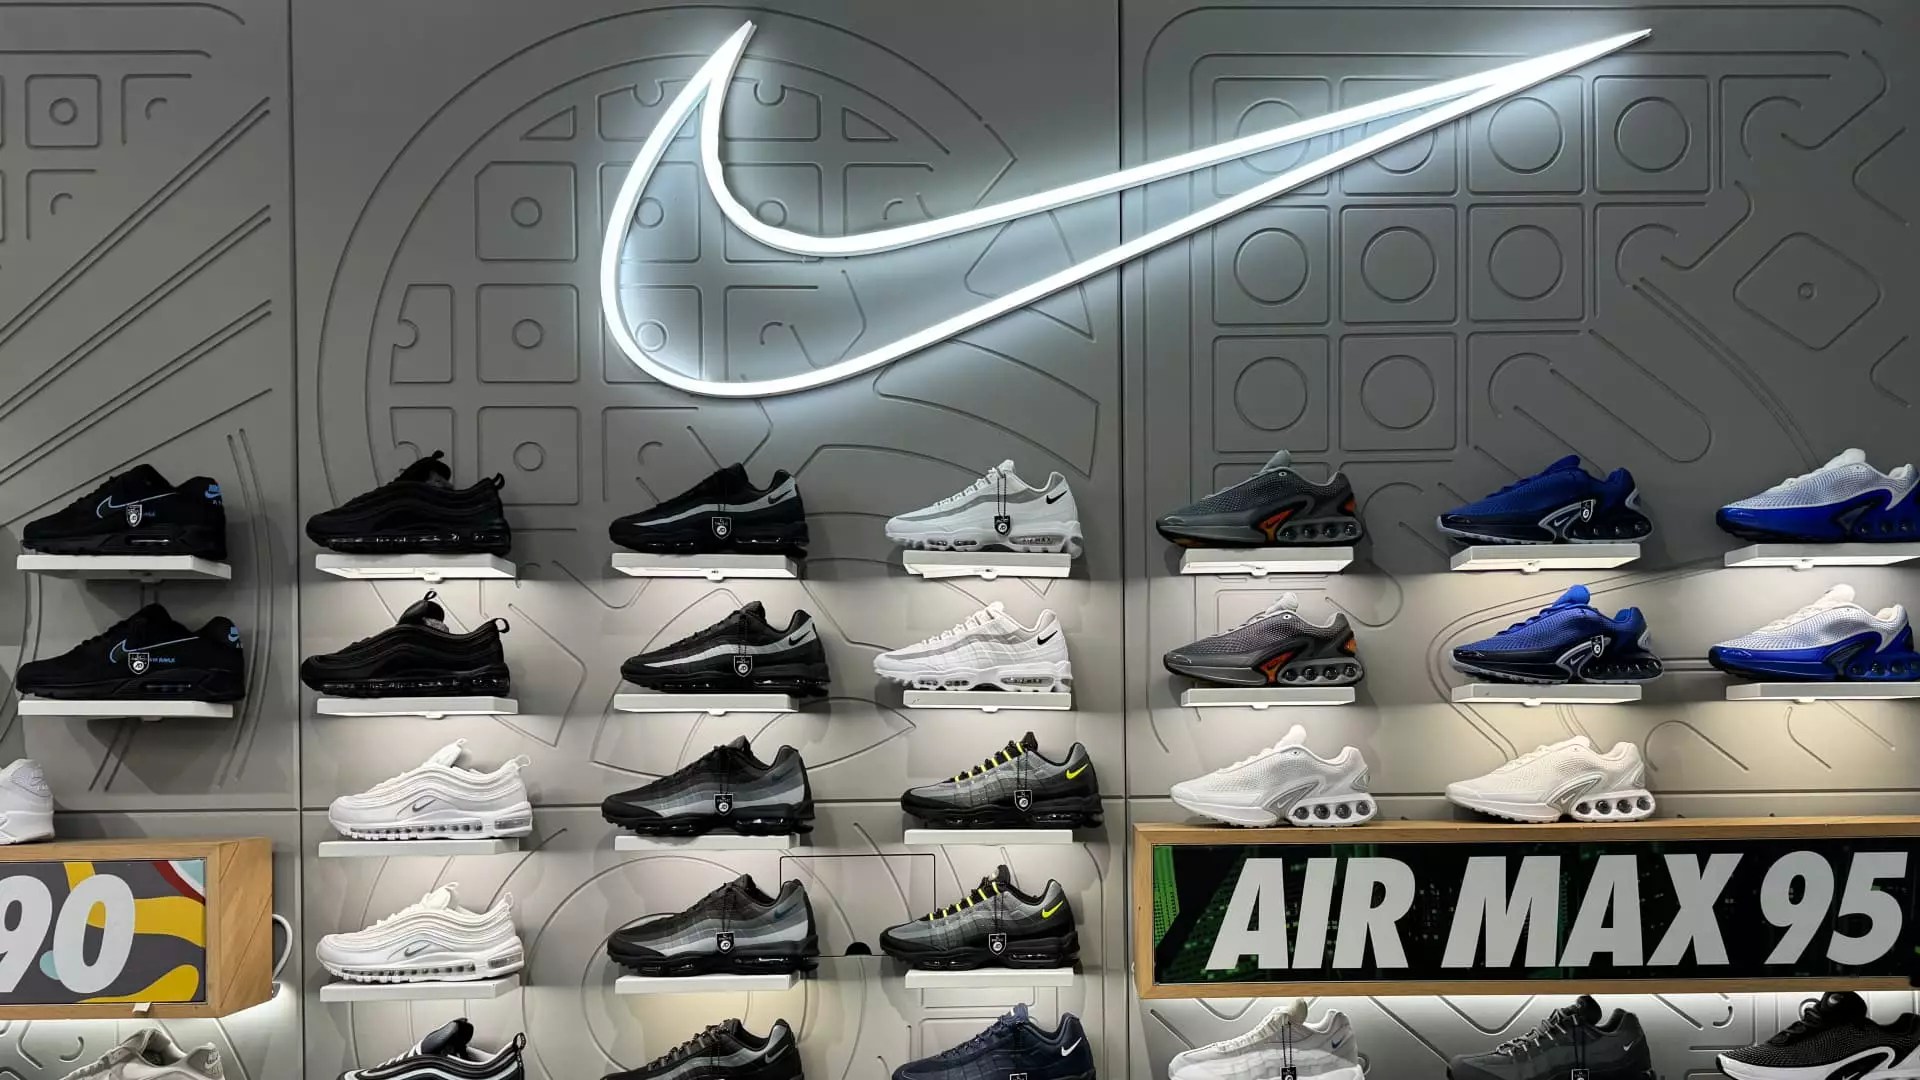
Nike Inc. (NKE) has recently captured the attention of investors and analysts due to a significant pullback in its stock price, following what can only be described as a disappointing earnings call. However, while immediate concerns loom large, there exists a silver lining in the form of long-term recovery scenarios. To grasp why this moment might present both challenges and opportunities, we must delve deeper into its price patterns, resistance levels, and market indicators.
After hitting a low of approximately $70 in early August, Nike’s stock had shown a pattern of resilience characterized by higher highs and higher lows. This constructively bullish trend provided hope for an upward trajectory, especially as NKE approached an important price resistance level. Specifically, the $90 mark serves as a 38.2% retracement level from a downtrend that persisted from December 2023 to August 2024. Many investors viewed this as a potential springboard for further gains.
However, the unexpected dip following the earnings report suggests that uncertainty still shadows the company’s stock. Such sudden changes in price often instigate fear among traders, leading them to rethink their strategies. Upon further inspection, despite this temporary setback, NKE’s price remains securely above a trendline support built from the swing lows of August and September. The technical framework suggests that the overarching bullish trend remains intact, at least for the time being.
Understanding the implications of various technical indicators can provide insights into Nike’s potential future movements. For instance, the Relative Strength Index (RSI) is a common measure of momentum; currently, NKE’s RSI hovers above the critical threshold of 40. This level is generally indicative of a bullish phase, as bear markets tend to see the RSI dip below this number. If NKE can maintain this momentum in the coming days, the pullback may merely be a healthy correction within an otherwise positive trend.
Moreover, the long-term perspective on Nike is not quite as favorable, with the stock trading below both the 150-week moving average and a downward-sloping 40-week moving average. Despite this persistent negative trend, a recent bullish signal from the weekly PPO (Percentage Price Oscillator) indicates a possible pivot toward recovery. Historically, similar signals have prompted noteworthy rallies. Particularly, since the COVID lows in 2020, NKE has witnessed substantial bullish follow-ups in the aftermath of such indicators, creating cautious optimism among market observers.
In light of the company’s long-term performance and its recent struggles, there emerges a dichotomy: while immediate volatility might evoke fear, the historical data provides a roadmap for potential recovery. Past bullish signals in 2022 and 2023 enabled a retest of the 150-week moving average, which, based on previous patterns, could suggest a possible upside toward the $105 range if NKE can regain traction.
Yet, this anticipated recovery wouldn’t be without substantial risks. The recent earnings report and the accompanying market reactions highlight the vulnerabilities within the sneaker and apparel market. It’s crucial for investors to understand that while historical data can guide expectations, mixed signals can cause erratic fluctuations in stock prices.
The current landscape for Nike Inc. symbolizes the classic battle between short-term uncertainties and long-term potential. While recent events caution investors against immediate buy-in, the broader technical indicators signal that the underlying bullish trend may still have legs. For those willing to exercise patience, this moment could represent a strategic entry point. Conversely, investors must remain vigilant, recognizing that volatility is a constant companion in the financial markets. By weighing technical, historical, and market sentiment factors carefully, stakeholders can better navigate the unfolding narrative of one of the most recognizable brands in the world.


Leave a Reply